
The current VBiTE board and steering committee have developed and adopted new operating principles and procedures (OPP) for the network. This document will be used to guide the transition of the RCN into the future VBiTE network. Please take a moment and read the OPP document, attached below. Once you read over the document and still want to receive email updates from VBiTE and participate in the community please fill out the following survey. Please note that only those that fill out the survey and agree to adhere to the OPP will continue to get emails from VBiTE.
Operating-Principles-And-Procedures-for-the-VectorBiTE-Research-Coordination-NetworkAuthor: Zach Gajewski

VBiTE 2020 Update
Due to the current circumstances of COVID-19, we will not be meeting before this year’s Ecological Society of America meeting. We will postpone an in-person meet up until spring 2021. We will provide more details when we have them. In the meantime, we are looking into providing some small virtual meetings. We will be sending out an email soon about what these meetings will entail.
Save the Date! VBiTE 2020
We are excited to announce that VBiTE 2020 will be held before the Ecological Society of America on August 2nd in Salt Lake City, Utah. More information about the meeting and funding will be posted soon.

VectorBiTE 2019 Survey
Please remember to take the VectorBiTE 2019 Survey. This survey is for all VectorBiTE members, whether you participated in the last meeting or not. We are looking for feedback from members about how VectorBiTE should move forward. The survey should only take 5-10 minutes to fill out and would help us figure out the future of VectorBiTE.
The survey can be found here.
VectorBiTE 2019 Video
Check out the cool video that E-STAR and Fondazione Edmund Mach did of VectorBiTE 2019!
VectorBiTE 2019: Meeting Recap

Fondazione Edmund Mach in Trento, Italy
VectorBiTE 2019 just finished at Fondazione Edmund Mach in Trento, Italy! Just like last year, the meeting was split into two parts; training and then a general working group meeting. The first three days were the training session where graduate students and postdocs came to advance their data management and statistical skill set. The last two and half days were set aside for working groups to meet and continue making progress on their research projects.
The training session started off with general linear and non-linear models and moved on to time series and eventually fitting Bayesian models. The trainees worked extremely hard during the first two days to learn a bunch of new skills and then on the third day they applied what they had learned to a group project on either their own data sets and data from Vectorbyte’s VecDyn or VecTraits database. The training material can be found here.
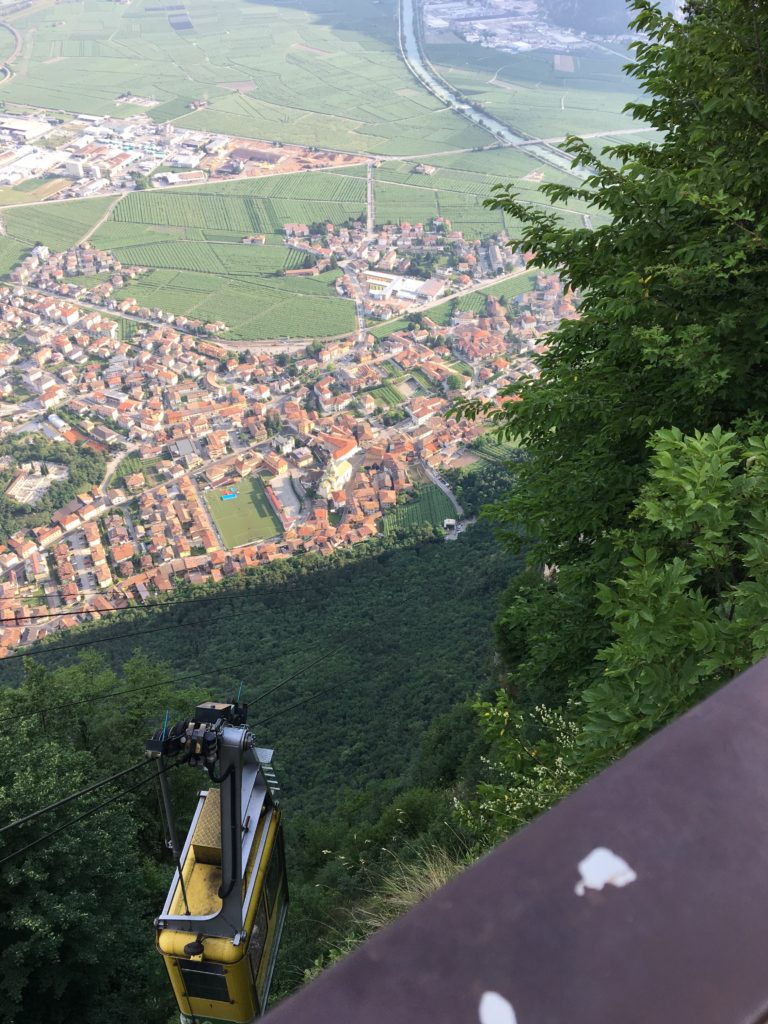
Tuesday night, the training participants and the board members were treated to an amazing dinner on one of the mountain near Fondazione Edmund Mach.
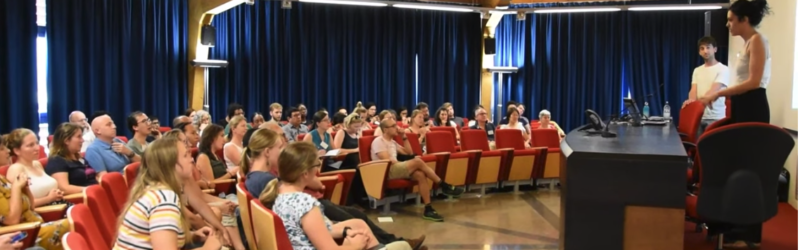
On Thursday morning, all the VectorBiTE 2019 participants met up and the training participants shared what they had been working on. The working group leaders then gave a brief overview of what each working group has been doing and what they hope to accomplish at the meeting. Trainees were able to join working groups and apply their new skill sets to help the working groups. Check out the working group one page summaries to find out about what each group accomplished in this year’s meeting!
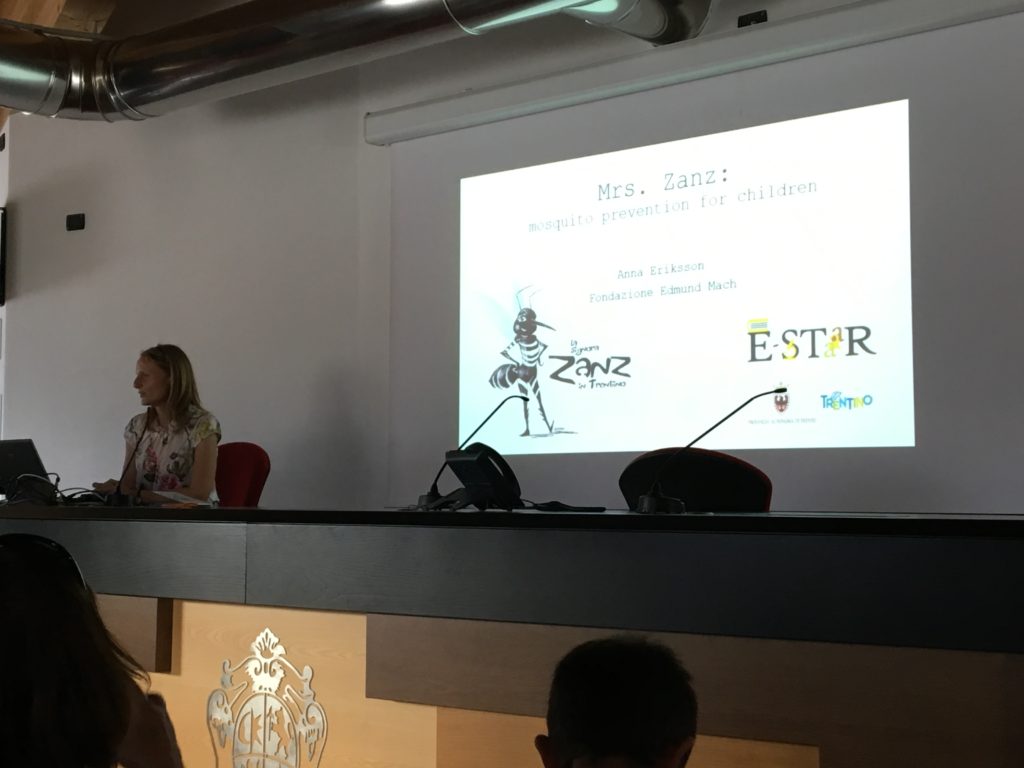
Presentation from E-STAR
During the working group portion of the meeting, we also got a video presentation from E-STAR, on mosquito prevention in Italy. The group showed us one of their videos that they use in their elementary school outreach events. The video focused on Ms. Mosquito and an elementary school child learning about how to prevent Ms. Mosquito from permanently moving to Trento, Italy. The video shared mosquito prevention methods that students can use and teach their parents.
This year’s meeting was at a stunning location filled with great scientific discussions. We are looking forward to seeing the outcomes of each working group from this year’s meeting!
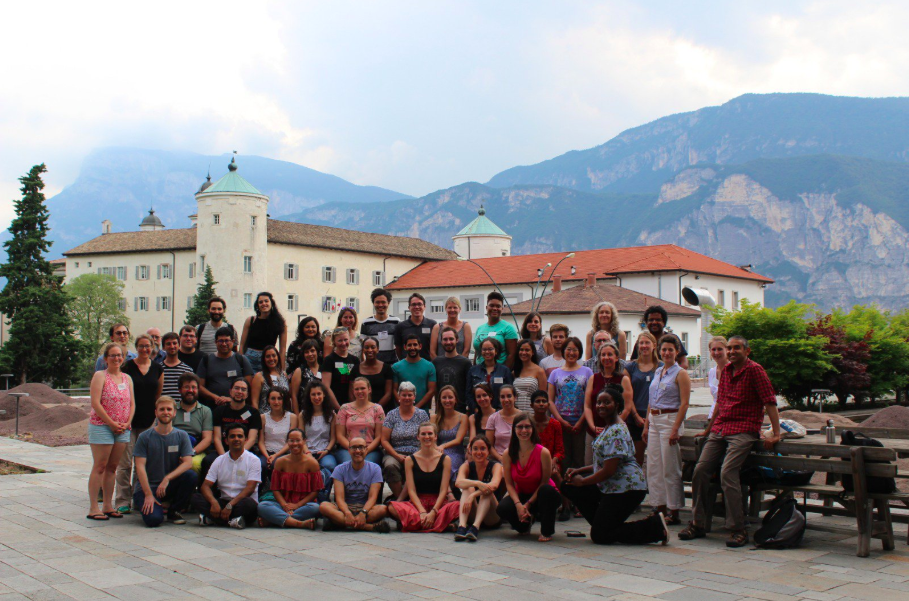
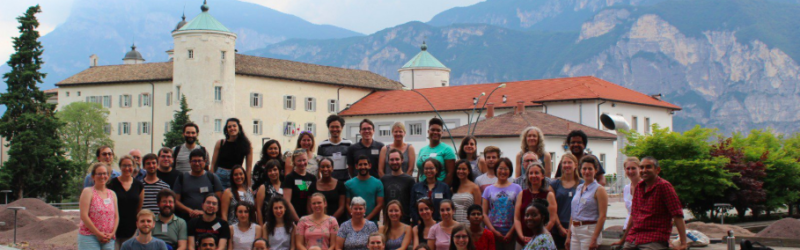
Group photo from VectorBiTE 2019! Thanks Marta for taking the photo.
The cost of a vector borne disease
Post by: Eli Fenichel
What is the cost of a
There are challenges to doing a study like this. First, there is getting the data. Second, is addressing bias, because behavior itself likely effects Lyme cases. We use two primary sources of data, supplemented with a few others. The core behavioral data comes from the American Time Use Survey (ATUS), which is collected and made public by the US Bureau of Labor Statistics. The ATUS asks a stratified random sample of the Current Population Survey to keep a minute-by-minute diary of all activities and locations of activities for a 24 hour period. The survey has been run every day since January 1, 2003. However, in our study we only use the first decade of observations. The survey tracks nearly 400 activity codes and 25 location codes (types of locations not exact coordinates). The data can be aggregated to the county level, though in many locations the data are more granular. We merge these data with year-by-county Lyme Disease case reports from the CDC. Additionally, we use some weather data and geographic data.
There are potential concerns with the data and with the process of simply regressing time spent outside on Lyme Disease cases. First, there could be challenges with the ATUS data, but BLS puts a lot of effort into the randomization and recruiting process, and these data are used in the context of many important economic and policy decisions. Second, there is concern that reporting of Lyme Disease may go down as Lyme becomes endemic. If this is the case, then the behavioral response we measure should be a lower bound and underestimate the cost. Regressing Lyme Disease cases on time spent outside using an ordinary least squares regression is likely biased because time spent outside is an important input into contracting Lyme. This sort of feedback problem is common in economic statistics, and economists and econometricians have developed a number of regression techniques to address these problems. Standard ordinary least squares regressions finds no effect of Lyme Disease cases on time spent outdoors, our econometric regression that accounts for the feedback (an Arellano-Bond estimator) finds a strong significant reduction in time spent outdoors that attenuates with increasing Lyme Disease cases in a county. Our estimates condition on population, minimum humidity, minimum temperature, precipitation, percent wilderness, percent city parks, maximum humidity, and maximum temperature. Overall, the estimate of the marginal effect of Lyme Disease cases on time spent outdoors is highly robust to model specification.
We believe that most researchers studying vector borne disease do so because they are concerned about social outcomes and public health. We are too. Yet, public health is not an end to itself, it is an important input into broader wellbeing. Quantifying the tradeoffs people make around avoiding getting sick can provide a credible lower bound to the cost of a vector borne disease and help policy makers better assess the tradeoffs involved in reducing vector borne infections. Increasingly, available data on human behavior makes these analyses possible. We encourage vector disease scientists to work with economists to further place the important science of vector borne pathogens in a social context.
Aedes Forecasting Challenge 2019
The Centers for Disease Control and Prevention (CDC) Division of Vector-Borne Diseases and the CDC Epidemic Prediction Initiative, in collaboration with the Council of State and Territorial Epidemiologists and the Centers of Excellence in Vector-Borne Diseases, are pleased to announce an open Aedes forecasting challenge for 2019.
Aedes aegypti and Ae. albopictus mosquitoes are the vectors of chikungunya, dengue, yellow fever, and Zika viruses, some of the most important arboviruses impacting human health globally. Because of their potential to transmit these viruses, these mosquitoes are targeted for surveillance and vector control in many areas of the United States. One of the challenges faced by agencies aiming to control these mosquitoes is that their seasonal and geographic range is not precisely known and may be changing.
The Aedes Forecasting Challenge focuses on predicting the seasonal presence of Ae.
Any questions can be directed to aedeschallenge@cdc.gov.
Thanks, Michael
Michael A. Johansson
CDC Division of Vector-Borne Diseases, San Juan, PR

VectorBiTE 2019 Applications are up!
We are now accepting applications for working group proposals and for the training session for VectorBiTE 2019. Applications for both will be due on Dec 15th, 2018. More information can be found on the VectorBite 2019 page. Links to the applications can be found below:
Thank you,
VBiTE Board

VBiTE 2019
![]()
We are excited to announce that VBiTE 2019 will be June 17th – 22nd 2019 at Fondazione Edmund Mach in Trento Italy. We will have both a training session and a general meeting this year. Applications for both parts of the meeting will be posted soon along with more details about VBiTE 2019.